Basic GNUPlot from the command line
There are many tools to plot or graph data points. The most common is the spreadsheet. However, there are instances when I would like to quickly analyze a data set then throw away the results when finished.
This is when I turn to GNUPlot for quick ad-hoc graphing.
Using the example data file:
jemurray@mbp-2019:~ $ head -5 /tmp/numbers.txt
108313357.93795292	14172930.125840904	43170655.360387966
54050912.74846953	14506014.564626597	55748443.87279168
92580121.1791793	15119971.132562589	61882800.61125066
74304697.01068823	14867594.969533907	84107289.18697126
97675591.11219549	16117629.751601066	71385054.6928251
Generate a basic graph with GNUPlot:
gnuplot -p -e "set format y '%.0f'; plot for [col=1:3] '/tmp/numbers.txt' using col with lines"
-p -> Keep the window open after the GNUPlot command exits. This is necessary while running in non-interactive mode from the command line, otherwise the image disappears after execution.
-e -> Execute the graphing commands.
set format y '%.0f' -> Change the default Y axis from scientific notation, to standard numbers.
plot for [col=1:3] -> In this example there are 3 columns of numbers in the input file. Create a for loop which graphs each column then plot the data.
'/tmp/numbers.txt -> Input file.
using col with line -> Plot the numbers on a line graph.
The resulting graph will look like this:
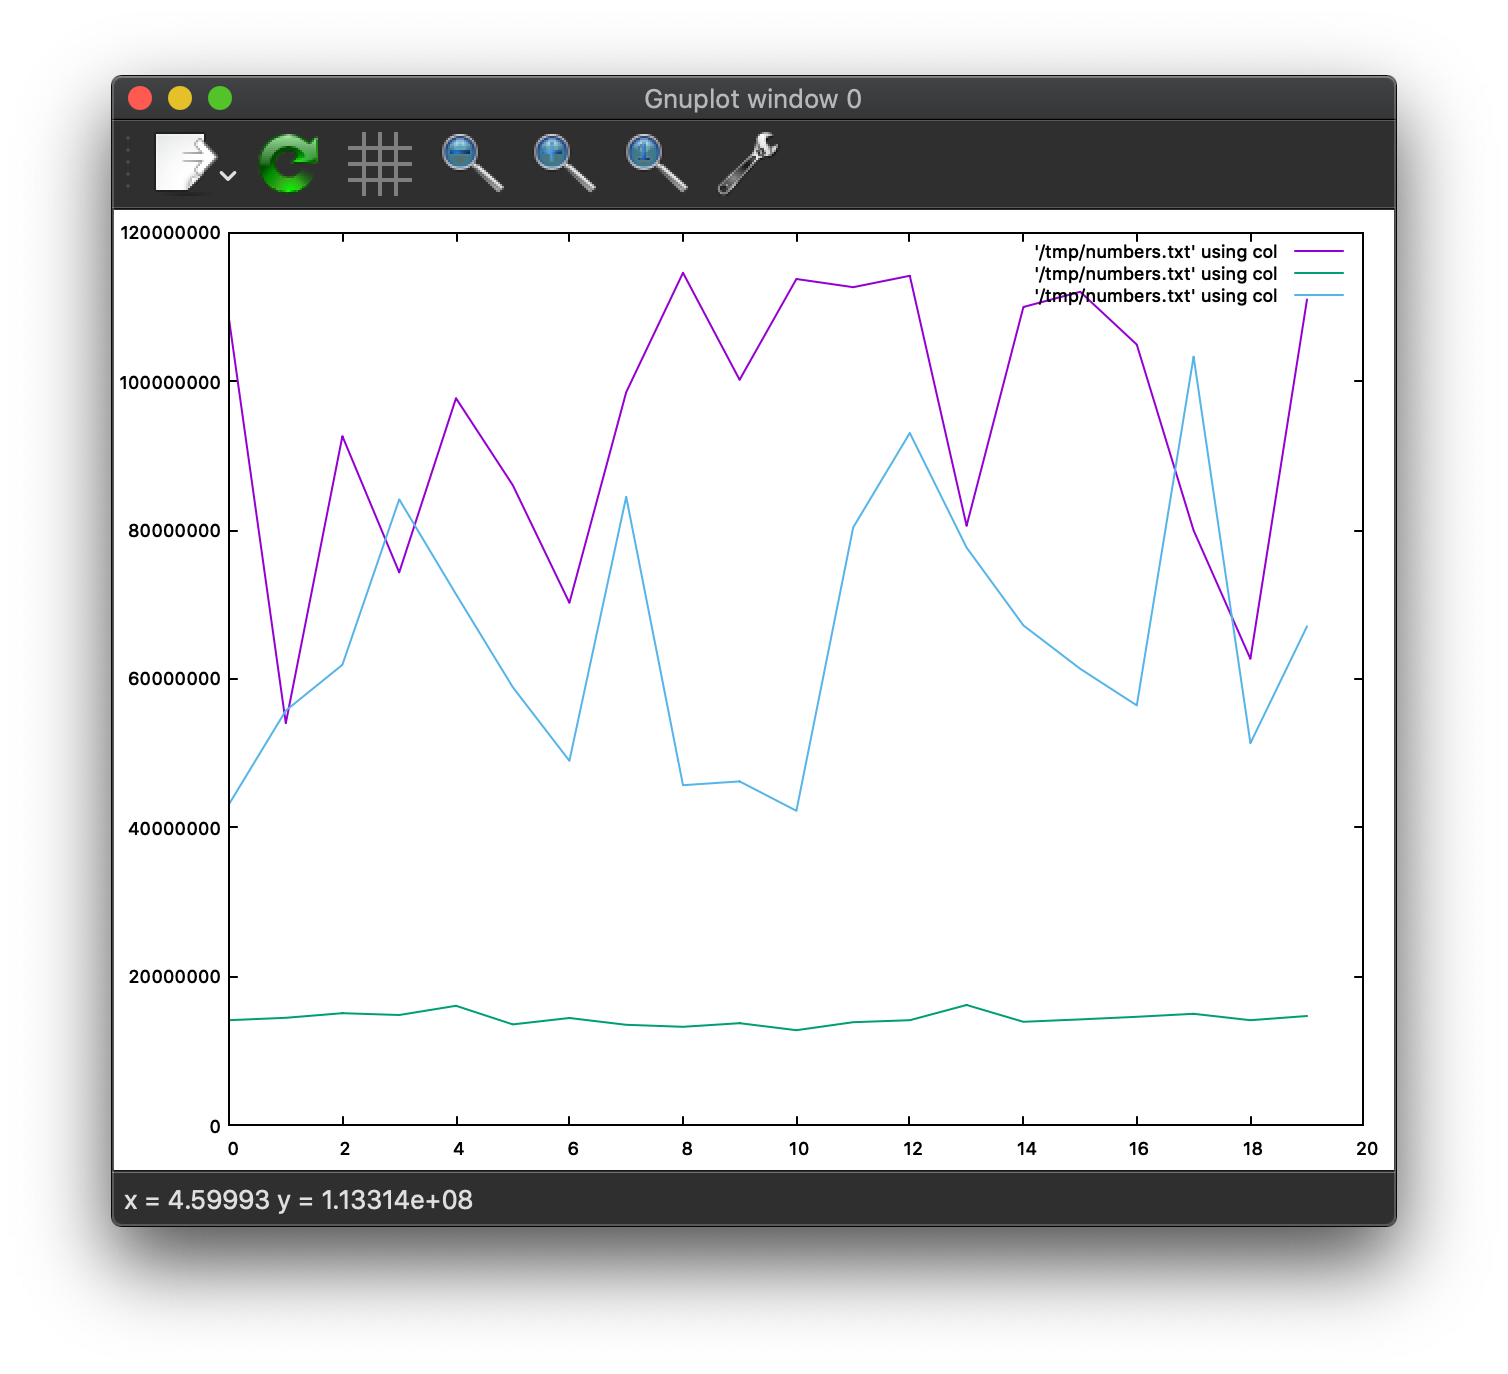
This command is not the easiest to remember. By using a Bash function, we can simplify it even more. Add this to the .bashrc:
function gplot() { gnuplot -p -e "set format y '%.0f'; plot for [col=1:20] '$1' using col with lines" ;}
[col=1:20] -> graphs up to 20 columns of numbers in the input file. If a column does not exist, a cosmetic error is displayed.
Example run, which generates the same graph displayed above:
jemurray@mbp-2019:~ $ gplot /tmp/numbers.txt
line 0: warning: Skipping data file with no valid points
line 0: warning: Skipping data file with no valid points
line 0: warning: Skipping data file with no valid points
line 0: warning: Skipping data file with no valid points
line 0: warning: Skipping data file with no valid points
line 0: warning: Skipping data file with no valid points
line 0: warning: Skipping data file with no valid points
line 0: warning: Skipping data file with no valid points
line 0: warning: Skipping data file with no valid points
line 0: warning: Skipping data file with no valid points
line 0: warning: Skipping data file with no valid points
line 0: warning: Skipping data file with no valid points
line 0: warning: Skipping data file with no valid points
line 0: warning: Skipping data file with no valid points
line 0: warning: Skipping data file with no valid points
line 0: warning: Skipping data file with no valid points
line 0: warning: Skipping data file with no valid points
If the graph is not too complex, the terminal can display output in ASCII format. I don’t consider this a good example, but it can be done:
jemurray@mbp-2019:~ $ gnuplot -p -e "set terminal dumb; set format y '%.0f'; plot for [col=1:20] '/tmp/numbers.txt' using col with lines"


 120000000 +---------------------------------------------------------------+
           |     +      +     +      ***   *******      + ****+      +     |
           |                       ** '/t**/number*.txt'**sing col ******* |
 100000000 |-+                    *   '/tmp/numbers.txt' using co$ #######-|
           |*           ***      *    '/tmp/numbe$$.txt' using co$$$$$$$$$ |
           |*    **    *        *               $  $$ *         $ $    *   |
           |*    * **$$$   ***  *$             $    * *         $  $   *   |
  80000000 |-*  *   $ *        * $$           $      $$$        $**$  *  +-|
           | *  *  $ *  $$$   * $ $           $                $   *$ *    |
           | * *  $             $  $         $          $$$    $    $*  $  |
  60000000 |-+**$$         $$$ $    $        $             $$$$      $$$ +-|
           |  $$               $    $       $                 $      $     |
           |$$                $      $$$$$$ $                              |
  40000000 |-+                             $                             +-|
           |                                                               |
           |                                                               |
           |                                                               |
  20000000 |-+  #####  ####                        #####        #####    +-|
           |####     ##    ########################     ########     ####  |
           |     +      +     +      +     +     +      +     +      +     |
         0 +---------------------------------------------------------------+
           0     2      4     6      8     10    12     14    16     18    20