Zeek Week 2020 - CTF Man or Machine writeup
This past week I was lucky enough to participate in the ZeekWeek 2020 capture the flag challenge. These are excellent events to pick up a new or hone an existing security related skill. By sharing the thought process behind solving one of these challenges, you get a window into the mind of the people who play, the tools required, and the skills they possess. This is my writeup behind solving challenge #1.
Unfortunately, I didn’t start until day 2 of the 3 day event. To make up ground, I started out by choosing challenges with the highest point values. Here is tip #1, don’t wait until the last minute to play.
There are many ways to tackle a CTF problem, one common method I use is to organize the data in a way that makes in easy to find changes in patterns. A system that is operating normal, has a specific pattern of data or logs. It is in these deviations from “normal” when we find the answers to our questions.
My first challenge was all about deviations in patterns:
Man or Machine? 300 This one is simple. There’s a pcap which contains 100 SSH connections.
Only 1 of the connections was human driven. The rest weren’t. All we want to know is the source port number for that 1 connection. You ONLY have 2 attempts, so don’t bruteforce guess!
All the connections used the same client, server, and configurations. If everything is the same and the payload contents are encrypted, what else could you compare?
Out of 100 connections, you have to find the session that is human generated.
I started off by making the following assumptions:
- Machine generated connections are going to have some unique patterns:
- Packet / frame sizes
- Source port increment distance
- Session times and intervals
- Session transfers
- Frame intervals
The first step is to organize the data in a way that makes it easy to compare with my initial assumptions.
The most common tools for analyzing packet captures are tcpdump, tshark, and wireshark. All open source tools that decode, analyze, display, and report on pcap files.
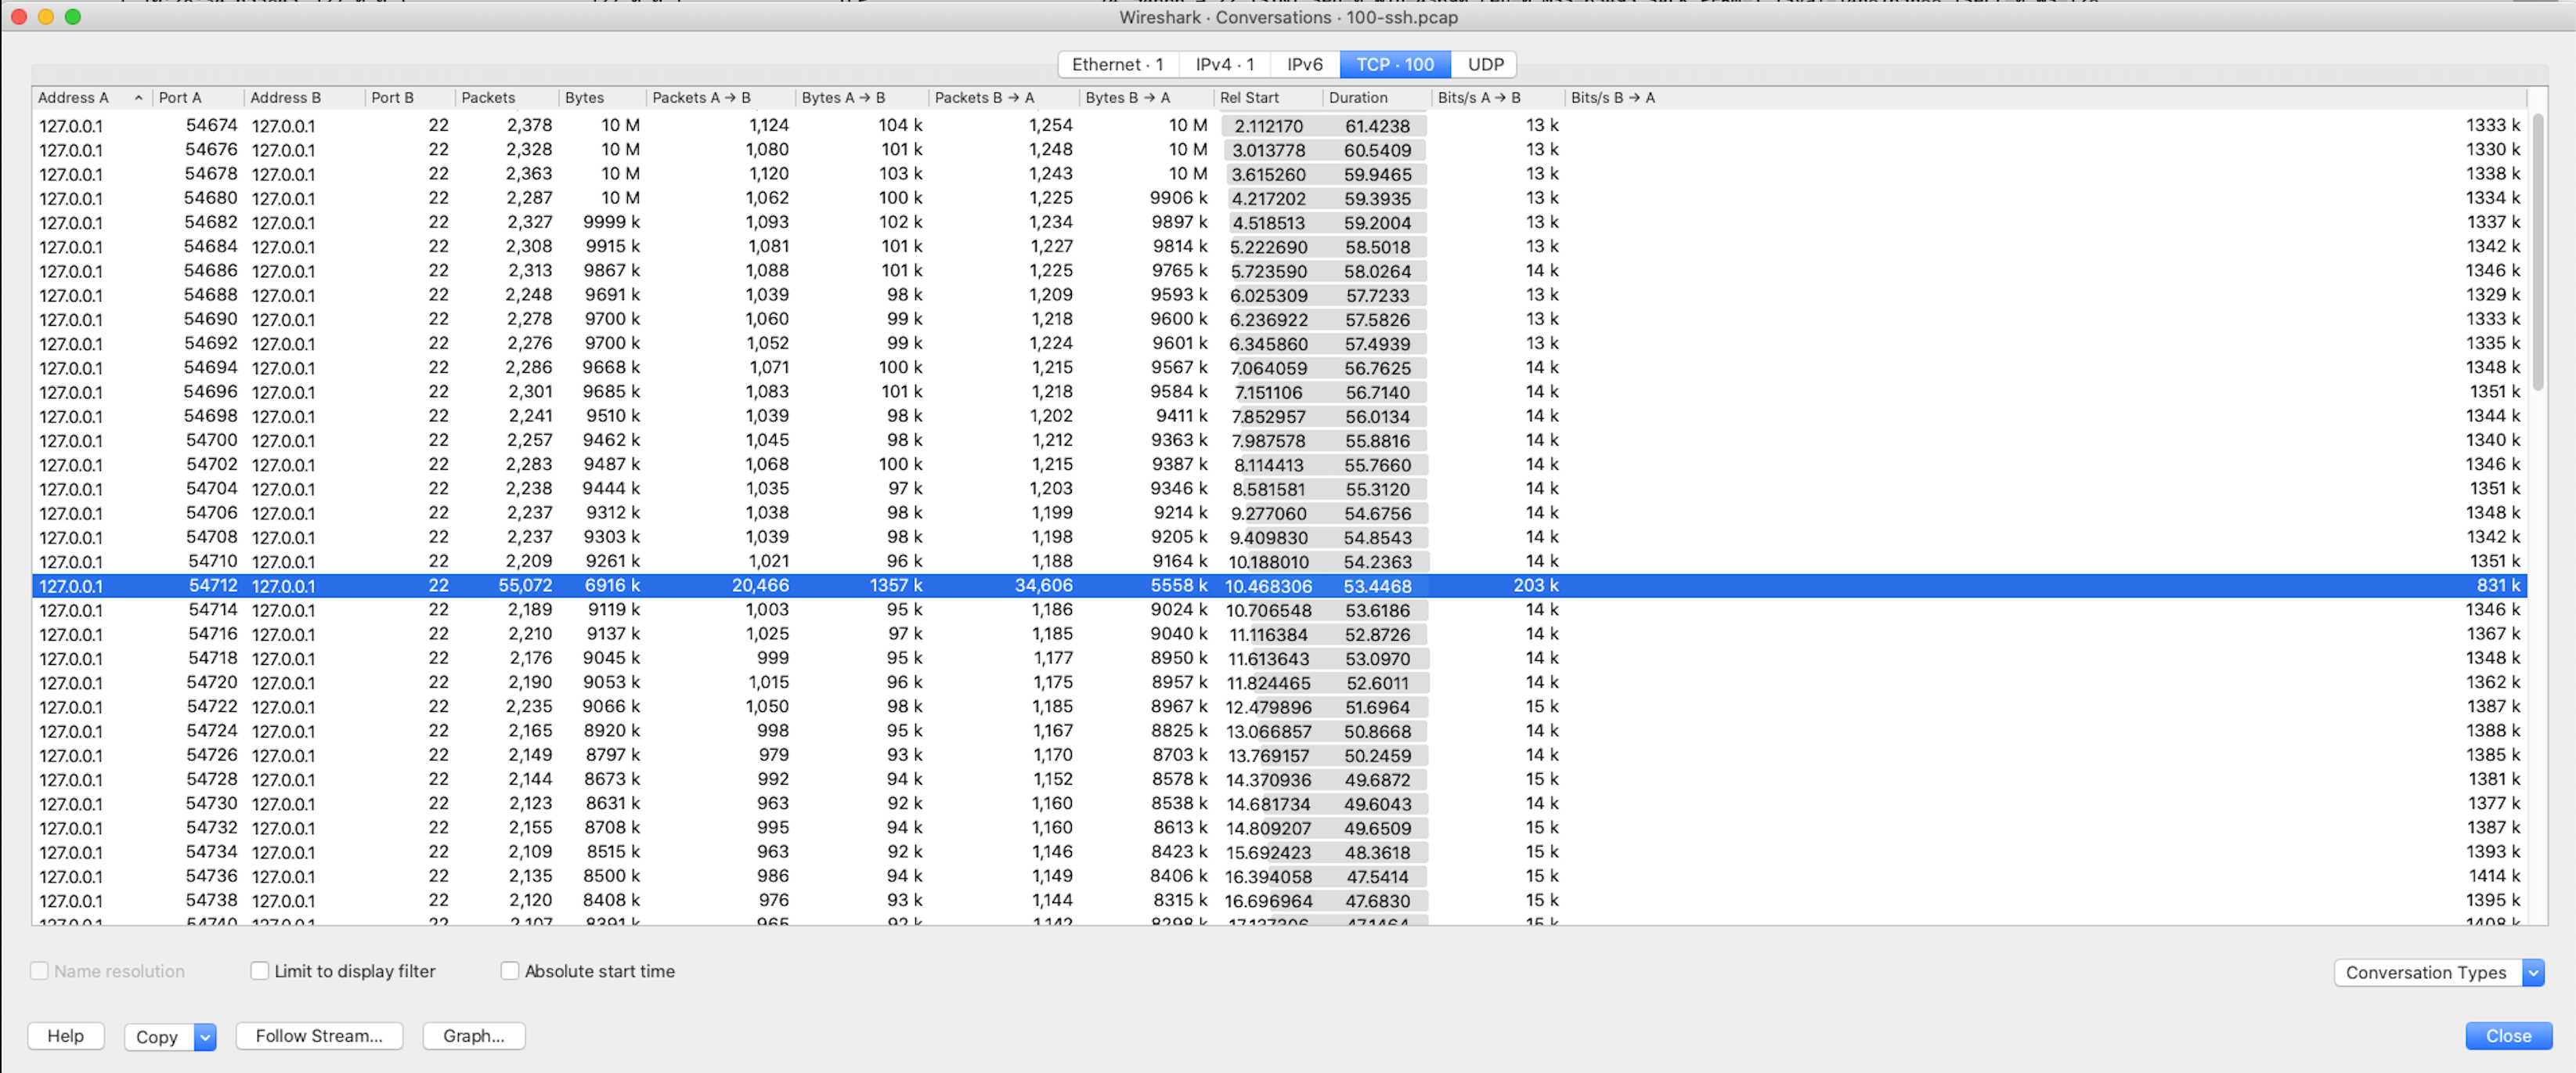
WireShark generates many types of reports. I started by running the conversations report. This allowed me to:
- Sort the data by each individual SSH session.
- Add data points to my assumptions, such as packets, bytes, intervals, etc.
In the 100 sessions displayed, it became clear there was one obvious change in the “typical” pattern of data. One session had a much higher Packet, Byte, and Bit count then all the others. The typical number of Packets was 2k compared to 55k, Packets A->B deviated by more then 9k, Packets B->A deviated by 33k.
To answer the question, what is the source port of the human made SSH session, the answer is 54712. The deviations in the data helped me to quickly identify the answer to this challenge. 300 points down, a lot more to go. Check tomorrow for the second solution.
